--> Estimating IPv6 & DNSSEC Deployment Status


Estimating IPv6 & DNSSEC External Service Deployment Status

Background and Methodology


Background and Methodology IPv6 & DNSSEC SnapShots
USG IPv6 & DNSSEC Statistics USG IPv4 Statistics
Industry IPv6 & DNSSEC Statistics Industry IPv4 Statistics
University IPv6 & DNSSEC Statistics University IPv4 Statistics
CFO Act Agency Summary Statistics USG IPv6 Enabled WWW Sites


Frequently Asked Questions (FAQ)


Background


IPv6 Service Deployment Monitor

    This monitoring tool has been developed to try to answer the questions above. The tool attempts to characterize that state of IPv6 deployment on external facing core network services and to track the progress of IPv6 deployments over time. The monitoring tool examines the IPv6 and IPv4 status of DNS, Mail, and Web services for domains on a regular (daily or weekly) basis. USG results post every day ~3pm while Industry and University results update on the weekends. The most recently collected data is displayed for both protocols as are the IPv6 adoption statistics over time.

    Note 1, this tool is unrelated to the USGv6 Profile and the USGv6 Testing Program. That is, no attempt is made to assess if the services monitored are running over IPv6 stacks that are compliant with the USGv6 Profile. The USGv6 Program is focused on acquisition and makes no recommendations about deployment scenarios. This tool on the other hand, only focuses on deployment issues.

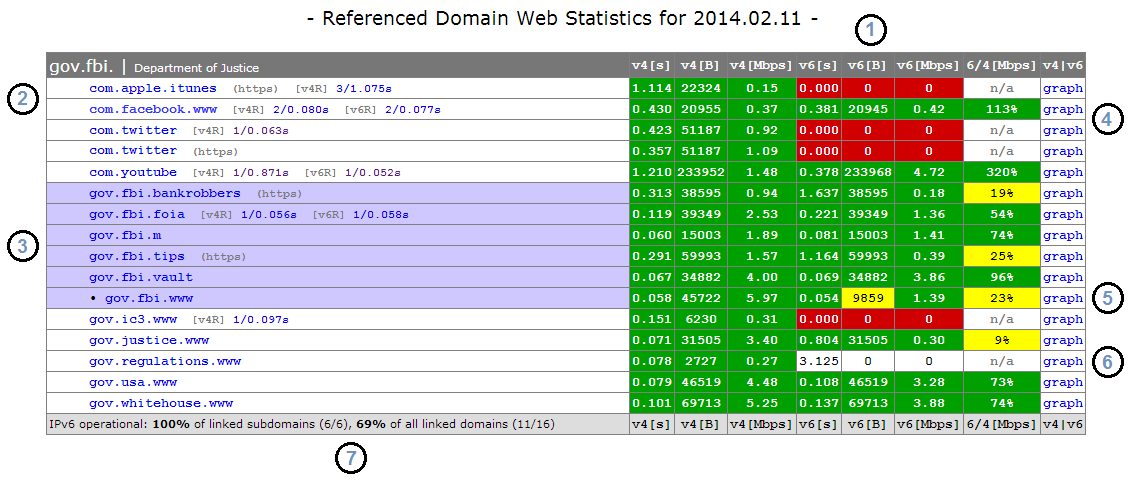
    For each monitored domain and service we report the estimated number of IPv4 interfaces for that service, followed by an estimate of the number of those interfaces that (a) have an IPv6 address assigned, (b) of those, the number of interfaces whose IPv6 addresses are reachable (simply a 'ping' test, which is [understandably] frequently blocked - no color designations are made here) to our monitor, and finally, (c) the number of those interfaces actually running the service over IPv6 (e.g., answering DNS queries). Finally we include a heuristic indication of whether the service in question seems to be operating within the domain in question or provided elsewhere. The result is an output as follows:

DomainOrganizationDNS MailWeb
gov.one.Agency One [3] 3/3/0 [I][1] 0/0/0 [I] [1] 1/0/0 [P]
gov.two.Agency Two [6] 5/5/5 [M][1] 1/0/1 [O] [1] 2/2/N [I]
gov.three.     Agency Three     [2] 0/0/0 [O][3] 1/0/0 [P] [4] 4/4/4 [O]
gov.four.Agency Four [S] 0/0/0 [L][0] 0/0/0 [-] [0] 0/0/0 [-]

    • Note that for a given service...
    • We color the cell red if there appears to be no IPv6 addresses assigned, e.g., 0/0/0
    • We color the cell yellow if addresses are assigned but the application service can not be reached, e.g., 1/0/0 or 3/3/0
    • We color the cell green if the service is fully supported over native IPv6, e.g., 4/4/4 or 1/0/1
    • We color the cell gray if the service is intentionally not assigned, i.e., [0] 0/0/0 [-]


Test Methodologies

    The USG monitor relies on the Cybersecurity and Infrastructure Security Agency's Official Public List of .GOV Domains. To [de]register a domain contact the registrar. The Industry monitor relies on the Fortune 1000 list as well as domains collected from the Alexa list of the top 100 sites in the US. We added to the Industry list with other relevant domains and learned ipv6 domain permutations, e.g., ipv6.google.com. The University list was borrowed from an NCAA site of Division 1 schools and has been amended over time. The domain lists under test are not meant to be exhaustive; the goal is to monitor a representation of all domains that exist, focusing on those of interest. Suggested additions of domains are welcome and may be added if appropriately interesting and relevant (i.e., those providing yet unmonitored service interfaces). The key for the output of the monitor is as follows:
[IPv4,S] :: Estimated number of IPv4 service interfaces
IPv6 server assignment is missing, e.g. 0/0/0
IPv6 addresses assigned to servers, e.g. 2/0/0
IPv6 addresses assigned and respond to ping, e.g. 2/2/0
IPv6 addresses are fully operational, e.g. 2/2/2,N
IPv6 addresses are intentionally not assigned, [0] 0/0/0 [-]
[I,P,O,M,L,-] :: Logical location of service relative to domain

[ For IPv4 Results :: values are v4_assigned/v4_reachable/v4_operational ]

    Given an agency domain and web site, a DNS query is performed to find all SOA, NS, and MX resource records and all unique A records assigned to the web server. For every resource record (RR) returned a comparison is performed to see if the record is [I]nside the domain under test, exists in the [P]arent domain, or is [O]utside of the domain under test. When examining all agency domain results for an individual resource record, if a combination of [I],[P],[O] exists the service under consideration is labelled as [M]ixed. Note, the [I,P,O] designation is determined by a string comparison and may not reflect actual ownership scenarios. For example, www.commerce.gov is an alias to www.doc.gov meaning both commerce.gov and doc.gov testing will examine www.doc.gov. The results will then show the commerce.gov web server to be [O]utside of commerce.gov and the doc.gov web server to be [I]nside of doc.gov despite commerce and doc being the same agency.

    The total number of returned records is indicated inside brackets, e.g. [4]. For instances where an NS record is not returned an [S] is used to indicate a SERVFAIL and a trailing [L] is listed to signify a Lame delegation. For instances where an MX record is not returned, or when no web servers are found, a [0] is entered in the count field and a [-] is placed in the location field. If all three services fail to return a record the Domain box is colored gray. Further, it is understood that certain domains were not meant to have all three services. When no MX records are found the box is colored gray. The same holds true when reporting the web results. However, all domains must have an NS record and the absence of one will leave the box colored red. An example of the above classifications:

DomainOrganizationDNS MailWeb
gov.one.Agency One [3] #/#/# [I][1] #/#/# [I][1] #/#/# [P]
gov.two.Agency Two [6] #/#/# [M][1] #/#/# [O][1] #/#/# [I]
gov.three.     Agency Three     [2] #/#/# [O][3] #/#/# [P][4] #/#/# [O]
gov.four.Agency Four [S] #/#/# [L][0] #/#/# [-][0] #/#/# [-]

    Momentarily disregarding the counting (#/#/#) information, and absent color designations, Agency One had three [3] NS records all internal [I] to the domain. One [1] MX record was found, which was inside [I] the domain. One [1] web server A record was returned in the [P] parent domain. For Agency Two, six [6] NS records were found, in a mix [M] of locations. One [1] MX record was returned from outside [O] of the domain. The lone [1] web server A record was internal [I]. For Agency Three, two [2][O] oustide NS records were found. Three [3] MX records were located, all of which were in the parent [P] domain and four [4] web server A records were returned from outside [O] of the domain. Finally, for Agency Four, no NS records were returned so it is marked as [S] SERVFAIL and [L] Lame. No MX record was found so a [0] and a [-] are listed. Likewise, zero [0] web server A records were returned so there can be no [-] location designation.

    After retreiving all of the domain's information, A and AAAA DNS lookups are performed on all service hostnames. From there, all uniquely assigned IP addresses are inserted into an array with the number of elements becoming the server assignment data point. For example, if three unique NS IP addresses were found the service count would be 3/#/#. Next, all addresses are pinged and the number that respond are represented as the reachable server data point. Continuing the example, if two of the three NS addresses respond to ping requests the service count becomes 3/2/#. Finally, there is an attempt to reach the service, on every address, over the Internet Protocol under test. The number of interfaces that respond are displayed as the operational data point. Concluding the example, if connections are successfully made to all three addresses, the service count would be 3/2/3. Also, if all attempts to a web server's IP addresses fail, a final attempt is made to the web server name. If that is successful an N is placed in the field, 3/2/N.

    To conclude the data presentation, colors are added to the table to enhance readability. A red field indicates there is no server IP assignment in the DNS. A yellow field indicates assignments are present, may or may not be reachable, but are not operational. A green field indicates the domain has at least one fully ipv6 operational address. Gray is used to indicate when a service is intentionally not assigned. Applying all of these concepts the final table will look as follows:

DomainOrganizationDNS MailWeb
gov.one.Agency One [3] 3/3/0 [I][1] 0/0/0 [I] [1] 1/0/0 [P]
gov.two.Agency Two [6] 5/0/3 [M][1] 1/0/1 [O] [1] 2/2/N [I]
gov.three.     Agency Three     [2] 0/0/0 [O][3] 1/0/0 [P] [4] 4/4/4 [O]
gov.four.Agency Four [S] 0/0/0 [L][0] 0/0/0 [-] [0] 0/0/0 [-]

    Additional data is collected during testing, including services that are outsourced, IPv6 allocations (CIDR), and operational service response times. Regardless of location (i.e, [I][P][O]), all service IP addresses, unique in scope to all domains being tested, are counted to produce a comprehensive Unique Configured Service Interfaces graph, Unique IPv6 Operational Serivce Interfaces Over Time graph and an IPv6 Operational Service Domains Over Time graph, all of which are displayed on top of the results page. Finally, the Domain and Organization entries are linked to the domain homepage and the agency results, respectively. The most basic metric collected is the comparison of IPv4 and IPv6 operational interfaces, represented daily in the USG Unique Configured Service Interfaces graph. The current graph is below.


Links : Referenced Domain Web Statistics

    The Federal domain information used by the monitor includes the domain name address for each domain. This URL is examined and all links found are tested for IPv6 operational readiness. The 'drill down' results for each domain are displayed on a page accessible from the Links column. The percentages shown in this column are explained in item #7 of the table explanations below.

DomainOrganizationDNSMail WebLinksDNSSEC
gov.fbi.                 Department of Justice       [6] 6/0/6 [I][1] 0/0/0 [I][2] 2/0/2 [O] 100%/69%S/V/C

    Each domain results page contains two graphs and a table with statistics. The first graph is a bandwith metric for the http GET of the domain's home URL, comparing the IPv4 and IPv6 throughput over time. The second graph is a box and whisker plot showing the range of IPv6 bandwidth measurements from all IPv6 operational URLs referenced in the Domain Under Test (DUT) homepage (the chart is entitled: Referenced Domain IPv6 Transfer Rate). The box and whisker graph displays the minimum, maximum, mean, 25th percentile, and 75th percentile of all bandwidth measurements. For readability, the box and whisker chart [only] displays the last month of data. An example of these graphs and table, with interpretation, is as follows:


    • 1. Header Information includes the title, date, domain, and agency. The collected vaules, for IPv4 and IPv6, are the seconds [s], bytes [B], and megabits per second [Mbps] for http GETs to the listed URL. The remaining two fields, 6/4[Mbps] and v4|v6, show a comparison of throughput values for the two protocols and the corresponding graph. Note, while throughput values are collected every time a URL appears, the daily graphs are generated using the throughput information collected on the initial inspection. This means a throughput graph may not exactly correspond to the data listed. For example, many domain sites reference www.facebook.com, and all of those domain tables will have unique throughput data for facebook, but the facebook graph will only show the data collected the first time facebook was inspected that day.

    • 2. The referenced URL portion of the table. Each line is a URL found on the DUT homepage. Results are displayed alphabetically and not in the order found. This line will note if the URL used was (https) and whether the IPv4 and IPv6 GETs were redirected, [v4R] and [v6R]. The redirection statistics link to the redirected URL and are in the format number_of_redirects/time_in_seconds. Above, in the com.facebook.www line, there were two IPv4 and two IPv6 redirections, which took 0.080s of the total 0.430s IPv4 GET and 0.077s of the total 0.381s IPv6 GET.

    • 3. All referenced URLs, which are subdomains of the original DUT are given a blue field. The URL of the DUT's homepage is noted with a leading "•" and is also blue.

    • 4. Collected results are displayed with color designations continued from the general monitor; a green field designates protocol operation while a red field indicates the GET was not successful, i.e., protocol not operational. Unless both IPv4 and IPv6 are operational there can not be a throughput comparison and the 6/4 field is populated with n/a. The graphs will plot whatever operational data there is every day.

    • 5. If the GET retrieval size for IPv6 is not within 10% (90-110%) of the IPv4 GET retrieval, the field is colored yellow. It is generally expected that the files returned will be close in size. Similarly, if the throughput for IPv6 is less than half (<50%) that of IPv4, the field is colored yellow. The yellow field signifies a condition, which may be problematic.

    • 6. On occasions where a response time is recorded (note the 3.125s, signifying a server was reached) but no data was returned, the field is colored white and treated as not operational.

    • 7. The number of referenced domains that are IPv6 operational. The first result is only for the subdomains (the URLs colored blue in #3). The second result is for all of the referenced domains. In this example, those percentages are 100% and 69%, which are the values shown in the Links column in the monitor results. The color designations pertain only to the referenced subdomain results: 100% is green (complete), 0% is red (no progress), and every value in between is yellow (in progress).


Domain Name System Security Extensions (DNSSEC)

    The last column in the table displays the DNSSEC status of the domain. The three values shown (e.g., S/V/C) represent the DNSSEC characteristics: Signed, Valid and Chained, which together establish one of four possible states: Good, Signed Island, Unsigned, and Error. The monitor sends a query for the DNSKEY of the zone and if a DNSKEY RR is returned the zone is considered Signed and Valid. If no DNSKEY records are found the zone is considered Unsigned. If an Error response is returned the monitor attempts to see if the error is DNSSEC related and sets the Valid bit accordingly. The monitor then sends a query to the .gov parent zone to see if the zone has uploaded its DNSSEC key material and has a valid secure chain (from .gov). If DNSSEC material is found the Chained value is set and, if not, the zone is an Island, meaning it may be signed but those signatures may not be trusted since the parent does not know they are signed. Results are collected to produce a DNSSEC Enabled Domains Over Time graph.

    The four states exist in five combinations of:

    • [S]igned ; [U]nsigned
    • [V]alid ; [I]nvalid ; [?](unknown) ; [-](n/a)
    • [C]hained ; [B]roken ; [-](n/a)

    • Unsigned [U/-/-] : The zone does not use DNSSEC and does not have any DNSSEC material in the .gov parent zone
    • Error [U/I/C] : The zone does not use DNSSEC but has DNSSEC material in the .gov parent, thus appearing to be an attack to DNSSEC clients
    • Error [S/I/C] : The zone uses DNSSEC but is invalid due to a DNSSEC error
    • Island [S/?/B] : The zone appears to use DNSSEC but does not have any DNSSEC material in the .gov parent
    • Good [S/V/C] : The zone uses DNSSEC and has DNSSEC material in the .gov parent

    The monitor color codes these designations as follows:

    DomainOrganizationDNSSEC
    gov.one.          Agency One     S/V/C
    gov.two.          Agency Two     (errors & islands)
    gov.three.          Agency Three     U/-/-

    Results are linked to the Sandia National Labs DNS Visualization Tool


Graph Representation


    The four graphs above show the service information returned by the monitor for the Department of Commerce on February 26, 2012 (2012.02.26). The DNSSEC Enabled Domains graph shows that 108 of the 131 domains tested were DNSSEC Operational (green), 6 had some level of DNSSEC configured but not working (In Progress,yellow) and 17 domains had no DNSSEC configurations (No Progress,red).

    The Completed IPv6 Enabled Domains graph consolidates all three IPv6 service checks for a domain and colors them as follows: if all three services (DNS,Mail,Web) are a combination of IPv6 Operational (green) and intentionally not assigned (gray) then the domain is considered IPv6 Operational. Likewise, if all three IPv6 services show a combination of No Progress (red) and intentionally not assigned (gray) then the domain is labeled No Progress. Any other combination of IPv6 service results gives the domain an In Progress (yellow) designation. In the Completed IPv6 Enabled Domains graph above 3 domains were Operational, 25 were In Progress and 103 showed No Progress. The Completed line on the IPv6 Enabled Domains bar graph shows the same metric as does any graph with Completed in the title; the SnapShot graphs and the CFO Summary page IPv6 graph.

    Finally, the IPv6 Enabled Services graph shows the combined IPv6 service results for all of the Department of Commerce agencies. There were 302 services measured (131 domains x 3 services each - those intentionally not assigned). For this testing cycle the DoC had 29 total Operational (green) services, 1 service In Progress (yellow) and 272 showing No Progress (red). The IPv6 Enabled Domains bar graph further reveals those numbers. Of the 29 Operational services, 26 were DNS and 3 were Web. The lone In Progress service was DNS. The 272 No Progress services were 104 (dns) + 55 (mail) + 113 (web). As a nod to progress, here are those graphs almost two years later...


Monitor Code Release

    Download version 1.1 of the Software (20211208)
    Download version 1.0 of the Software (20120717)

    [Note: This Code collects DNS/Mail/Web/DNSSEC data. The "Links" column and associated Domain result pages are generated separately.]

    Below is an example of the detailed results generated with some explanation...

    - icann.org - 20120707 - 17:53 -

    SOA server: dns1.icann.org.
    Auth servers: ns.icann.org. I c.iana-servers.net. O d.iana-servers.net. O a.iana-servers.net. O b.iana-servers.net. O
    Mail servers: pechora8.icann.org. I pechora1.icann.org. I pechora2.icann.org. I pechora3.icann.org. I pechora4.icann.org. I pechora5.icann.org. I pechora6.icann.org. I pechora7.icann.org. I
    Web servers: www.vip.icann.org. I

    Find the server names and their location ([I][O][P]) with respect to the domain under test

    Auth server A Records: ns.icann.org. 199.4.138.53 c.iana-servers.net. 139.91.1.10 d.iana-servers.net. 199.4.29.153 a.iana-servers.net. 199.43.132.53 b.iana-servers.net. 199.43.133.53
    Mail server A Records: pechora8.icann.org. 192.0.46.74 pechora1.icann.org. 192.0.33.71 pechora2.icann.org. 192.0.33.72 pechora3.icann.org. 192.0.33.73 pechora4.icann.org. 192.0.33.74 pechora5.icann.org. 192.0.46.71 pechora6.icann.org. 192.0.46.72 pechora7.icann.org. 192.0.46.73
    Web server A Records: www.vip.icann.org. 192.0.32.7

    Find the IPv4 addresses for the server names

    Auth server AAAA Records: ns.icann.org. 2001:500:89::53 c.iana-servers.net. 2001:648:2c30::1:10 d.iana-servers.net. 2620:0:2ee0:2::153 a.iana-servers.net. 2001:500:8c::53 b.iana-servers.net. 2001:500:8d::53
    Mail server AAAA Records: pechora2.icann.org. 2620:0:2d0:201::1:72 pechora4.icann.org. 2620:0:2d0:201::1:74 pechora5.icann.org. 2620:0:2830:201::1:71 pechora7.icann.org. 2620:0:2830:201::1:73
    Web server AAAA Records: www.vip.icann.org. 2620:0:2d0:200::7

    Find the IPv6 addresses for the server names

    Auth server CIDR is: 2001:500:89::/48
    Mail server CIDR is: 2620:0:2D0::/48
    Web server CIDR is: 2620:0:2D0::/48

    Find the IPv6 routing prefix

    IPv4 Auth reachability: ns.icann.org. 199.4.138.53 5.144 d.iana-servers.net. 199.4.29.153 5.442 a.iana-servers.net. 199.43.132.53 8.259 b.iana-servers.net. 199.43.133.53 80.502
    IPv4 Mail reachability: pechora8.icann.org. 192.0.46.74 76.930 pechora1.icann.org. 192.0.33.71 78.856 pechora2.icann.org. 192.0.33.72 77.900 pechora3.icann.org. 192.0.33.73 78.702 pechora4.icann.org. 192.0.33.74 109.863 pechora5.icann.org. 192.0.46.71 70.048 pechora6.icann.org. 192.0.46.72 71.814
    IPv4 Web reachability: www.vip.icann.org. 192.0.32.7 75.425

    Find the average ping round trip time for the IPv4 addresses, e.g., 75.425 ms

    IPv6 Auth reachability: ns.icann.org. 2001:500:89::53 71.407 c.iana-servers.net. 2001:648:2c30::1:10 144.517 d.iana-servers.net. 2620:0:2ee0:2::153 4.561 a.iana-servers.net. 2001:500:8c::53 3.620 b.iana-servers.net. 2001:500:8d::53 76.317
    IPv6 Mail reachability: pechora2.icann.org. 2620:0:2d0:201::1:72 85.104 pechora4.icann.org. 2620:0:2d0:201::1:74 83.619 pechora5.icann.org. 2620:0:2830:201::1:71 4.226
    IPv6 Web reachability: www.vip.icann.org. 2620:0:2d0:200::7 72.390

    Find the average ping round trip time for the IPv6 addresses, e.g., 72.390 ms

    IPv4 operational auth: ns.icann.org. 199.4.138.53 7 c.iana-servers.net. 139.91.1.10 143 d.iana-servers.net. 199.4.29.153 8 a.iana-servers.net. 199.43.132.53 11 b.iana-servers.net. 199.43.133.53 85
    IPv4 operational mail: pechora8.icann.org. 192.0.46.74 220 pechora1.icann.org. 192.0.33.71 220 pechora2.icann.org. 192.0.33.72 220 pechora3.icann.org. 192.0.33.73 220 pechora4.icann.org. 192.0.33.74 220 pechora5.icann.org. 192.0.46.71 220 pechora6.icann.org. 192.0.46.72 220
    IPv4 operational web: www.vip.icann.org. 192.0.32.7 0.144

    Find the service query time via IPv4; Auth is in ms, Web is in seconds, Mail will show '220'

    IPv6 operational auth: ns.icann.org. 2001:500:89::53 77 c.iana-servers.net. 2001:648:2c30::1:10 157 d.iana-servers.net. 2620:0:2ee0:2::153 5 a.iana-servers.net. 2001:500:8c::53 8 b.iana-servers.net. 2001:500:8d::53 76
    IPv6 operational mail: pechora2.icann.org. 2620:0:2d0:201::1:72 220 pechora4.icann.org. 2620:0:2d0:201::1:74 220 pechora5.icann.org. 2620:0:2830:201::1:71 220
    IPv6 operational web: www.vip.icann.org. 2620:0:2d0:200::7 0.145

    Find the service query time via IPv6; Auth is in ms, Web is in seconds, Mail will show '220'

    authsrvs/v4configured/v4reachable/v4operational = 5/5/4/5
    mailsrvs/v4configured/v4reachable/v4operational = 8/8/7/7
    wwwsrvs/v4configured/v4reachable/v4operational = 1/1/1/1

    dnssec results: S,V,C,G

    authsrvs/v6configured/v6reachable/v6operational = 5/5/5/5
    mailsrvs/v6configured/v6reachable/v6operational = 8/4/3/3
    wwwsrvs/v6configured/v6reachable/v6operational = 1/1/1/1

    Show all testing totals; dnssec results include color designation (G,Y,R)


    The results for this domain would have the following appearance:
Domain   Organization    DNS MailWeb    DNSSEC   
org.icann.      ICANN [5] 5/5/5 [M][8] 4/3/3 [I] [1] 1/1/1 [I]S/V/C


Additional Information

    Please note the usgv6-deploymon.antd.nist.gov server you are viewing is hosted on the NIST, Department of Commerce [2610:20:6000/36] IPv6 allocation. The results shown here were collected by our monitor, which has IPv6 connectivity through the same network. For IPv6 service tests to be successful, the Domain Under Test (DUT) must have a route to [2610:20:6000/36].

For comments, questions or suggested domains please contact: itrg-contact@list.nist.gov